Filter Indications


Foot & Ankle Indications
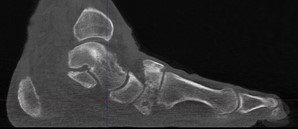
With weight bearing CT imaging ,“you can solve that Lisfranc case no one else can. It opens up the midfoot, which historically has been a problem for us.” – Dr. Gary Briskin, DPM
WBCT VS. MRI
MRI, which has a wide consensus as the preferred modality to directly assess a ligament’s integrity, has also been utilized to evaluate these injuries with a high sensitivity and good specificity. However, MRI cannot be routinely obtained under weight-bearing conditions. Resultantly, pathological alignment, which is an important parameter to determine the efficacy of an operation, may not be detected. Due to these discussed shortcomings of MRI, WBCT may be the preferred imaging modality when assessing joint space asymmetry of the foot. (Sripanich et al, Skeletal Radiol)
MRI studies can create better images of soft tissues, but are but not required to diagnose a Lisfranc injury. The studies will only show what structures were damaged but not give information about the stability of the midfoot. Instability of the midfoot is the indication to surgically repair the Lisfranc injury. (Clinical insight provided by Dr. Steven Neufeld, MD)
WBCT VS. CT
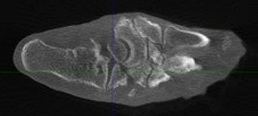
Computerized tomography scan (CT): A standard CT scan is more detailed than x-rays and can help evaluate the extent of the injury and the number of joints involved. It is useful to help guide the surgical plan but does not always reveal whether or not midfoot instability is present. A weight-bearing CT scan has all the benefits of a standard CT scan with the additional advantages of revealing the stability of the midfoot. Surgery is recommended for all Lisfranc injuries with a fracture in the joints or with abnormal positioning of the midfoot joints. Weight bearing CT scans can reveal any subluxation/dislocation (abnormal positioning) of the involved joints. (Clinical insight provided by Dr. Steven Neufeld, MD)
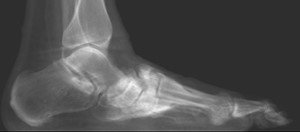
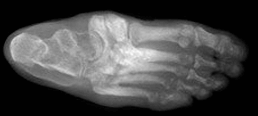
WBCT vs. X-RAY
Although of questionable accuracy, the current gold standard to assess these injuries is through bilateral weight-bearing radiography. Current criteria for diagnosis delineates observance of a 2-mm widening of the first metatarsal-medial cuneiform and second metatarsal joint space relative to the contralateral side on bilateral weight bearing radiography. However, unavoidable overlapping osseous structures may obscure visualization when using radiography, making interpretation less reliable. WBCT, which provides clearer visualization of bony landmarks, can also be utilized for evaluation. (Sripanich et al, Skeletal Radiol)
A retrospective chart review of 56 patients (112 feet) was conducted who had undergone WBCT of the bilateral lower extremities and were indicated for either a clinically diagnosed Lisfranc injury or clinically diagnosed tibiofibular syndesmosis injury. Evaluation of the Lisfranc ligamentous complex (LLC) included: distance from base of first metatarsal to base of second metatarsal (Base M1-M2), distance of the base of the second metatarsal to medial cuneiform (M2-C1), inter-cuneiform distance, the presence of first and second tarsometatarsal (TMT) joint incongruity in the axial view, and sagittal descent between the bases of the first and fifth metatarsal joint as a measure of curvature or collapse of the midfoot arch (most inferior point of first metatarsal base to most inferior point of fifth metatarsal base).
The research showed that in patients without Lisfranc injury the Base M1-M2 was 2.7 +/- 0.7mm, the M2-C1 was 3.7 +/- 0.7mm, the intercuneiform distance was 1.2 +/- 0.3,, and the sagittal descent was 12.2 +/- 5.4mm.
Patients with injury to LLC had a larger M1-M2 base distance and M2-C1 interval compared to the uninjured side. Base M1-M2 was 2.7 +/- 0.7mm, the M2-C1 was 3.7 +/- 0.7mm, the intercuneiform distance was 1.2 +/- 0.3, and the sagittal descent was 12.2 +/- 5.4mm.
PROPOSED STANDARDIZED WBCT MEASUREMENTS
A novel method evaluates the Lisfranc joint complex using 1-Dimensional, 2-Dimensional, and 3-Dimensional measurements from a WBCT scan among patients with operatively confirmed Lisfranc instability, as well as among a cohort of control patients without foot injury using the following measurements on both groups:
- Lisfranc joint (medial cuneiform-base of second metatarsal) area
- C1-C2 intercuneiform area
- C1-M2 distance
- C1-C2 distance
- M1-M2 distance
- First Tarsometatarsal (TMT1) angular alignment
- Second Tarsometatarsal (TMT2) angular alignment
- TMT1 dorsal step-off distance
- TMT2 dorsal step-off distance
- Volume of Lisfranc joint in coronal plane
- Volume of Lisfranc joint in axial plane
Results found that amongst patients with unilateral Lisfranc instability, all WBCT measurements were increased on the injured side as compared to the contralateral uninjured side (p values ranging from <.001 to .008). Volumetric measurements in the coronal and axial plane had a higher sensitivity (92.3%; 91.6%, respectively) and specificity (97.7%; 96.5%, respectively) than 2D and 1D Lisfranc joint measurements. The control group showed no difference in any of the measurements between the two sides, further underscoring the reliability of the contralateral extremity as an internal control. (Bhimani et al, Journal of Orthopaedic Research)
Osteoarthritis occurs when the protective cartilage that cushions the ends of bones wears down over time. Osteoarthritic findings in the foot are often characterized by asymmetric joint space narrowing, subchondral cyst, subchondral sclerosis, and osteophyte formation. Common sites for arthritis in the foot include the first metatarsophalangeal joint, as well as the metatarsosesamoid joints.
Case Report
WBCT was used for surgical planning and postoperative evaluation in an unusual case of bilateral atraumatic erosive subtalar osteoarthritis with unilateral subtalar collapse. The authors emphasized the value for pre-planning, as it allowed for relevant angles to be measured in three dimensions, helped determine the presence of posterior osteophytes, and the anterior and lateral impact of the ankle. Post-operatively, the WBCT permitted a functional and anatomically correct assessment. (Welck et al, Foot Ankle Surg)
Studies
Orientation of the subtalar joint as measured on WBCT could be a determinant factor in the development of ankle arthritis. (Krahenbuhl et al, Foot Ankle Int)
WBCT vs. X-Ray
Weight bearing X-Rays and WBCT were compared in 96 patients with OA. Fifty patients had moderate OA and 46 patients had severe OA. The authors documented the presence of abnormal internal rotation of the talus in patients with osteoarthritis in varus, which was more frequently observed in the group with severe OA than those with moderate OA. They emphasized rotation could not be noted in conventional X-Rays since axial images cannot be acquired. (Kim et al, Skeletal Radiol)
Limitations of plain radiographs may contribute to poor sensitivity in the detection of knee osteoarthritis and poor correlation with pain and physical function. Three‐dimensional (3D) joint space width (JSW), measured from weight‐bearing computed tomography (CT) images, may yield a more accurate correlation with patients’ symptoms. (Kothari et al, J Orthop Res)
Hallux Valgus
Hallux valgus is a lateral deviation of the great toe of the metatarsophalangeal joint. It is a slowly progressive condition resulting from a series of biomechanical changes, and is a multiplanar deformity with transverse, sagittal and rotational aspects. More than 1/3 of the population over 65 has this deformity. Over 100 operative methods have been described in the literature.
Studies
WBCT allowed demonstration that hypermobility of the first tarsometatarsal joint occurs not only in the sagittal plane with increased dorsiflexion, but also into other planes, with increased inversion and adduction. The hypermobility was shown to be present not only in the first TMT joint but to extend across the whole first ray. (Netto et al , Foot Ankle Clin N, 2020)
WBCT vs. CT
There is an increase in medial deviation of the first metatarsal and pronation of the first toe on images with load in patients with hallux valgus. (Collan et al, Foot Ankle Surg)
WBCT vs. X-Ray
Weight bearing AP, lateral and oblique view plain radiographs provide limited information because of the rotational, three-dimensional nature of the deformity. On X-Ray, it is difficult to image the sesamoids for relative displacement and chondral wear, and it requires creative positioning, wedges and taping to achieve an adequate view, but the patient is no longer in a natural stance. It is also difficult to assess rotational changes of the metatarsal. Lastly, subchondral cysts in the metatarsal head may be observed, but exact size and orientation may be obscured. (Welck et al, Foot Ankle Clin N Am)
Weight bearing conventional radiographs provide limited, sectorized, and biased information regarding the complex and 3-dimensional nature of hallux valgus (HV) deformity, leading to potential misinterpretation and poor understanding. (Netto et al, Foot Ankle Clin N Am)
Measurements of pronation deformity in HV using WBCT do not correlate with traditional weight bearing conventional radiograph HV and itermetatarsal angulations. Surgical planning of HV should sonsider the 3-dimensional pattern of the deformity, and WBCT images should be used when available. (Netto et al, Foot Ankle Clin Am)
HV is a 3-dimensional deformity that occurs in the coronal, sagittal, and axial planes. Due to the complexity and multiplanar views required, the limitations of weight bearing X-Ray are restricting. Supplemental information obtained from the third dimension in weight bearing CT scans is essential for appropriately measuring 1st metatarsal pronation. Furthermore, the pronation measurements on weight bearing X-Ray are weakly associated at best with pronation measurements on WBCT. Therefore, pronation measured on weight bearing X-Ray is not a substitute for pronation measured on WBCT. (Tamanna J. Patel et al, Foot Ankle Surgery)
There is a strong intermethod correlation between three-dimension (3D) and two-dimension (2D) intermetatarsal angle (IMA) measurements in both hallux valgus (HV) and controls, with higher intraobserver reliability observed in 3D measurements.
Researchers stated that their findings held several important implications; validation that weight bearing CT (WBCT) 3D measurements can reliably assess multiplanar deformities of the foot and ankle, which is crucial for patients with HV in which the severity of the deformity, in addition to clinical symptoms, dictates the choice of treatment. Although conventional radiographs are useful in demonstrating subluxation of the first metatarsophalangeal joint, pronation in the sagittal and coronal planes may not be fully appreciated in 2D, implying that 2D radiographs may not be sufficient and 3D measurements may be more appropriate. (Dr. Jonathan Day et al., Foot and Ankle International)
PROPOSED STANDARDIZED WBCT MEASUREMENTS
When evaluating hallux valgus the 3D weight bearing CT might be the only imaging study needed. All relevant data can be obtained in a single study” and rotational changes can be measured accurately. (Collan et al, Foot Ankle Surg)
Semi-Automatic Software Measurements
Semi-automatic 3D measurements of the Hallux Valgus Angle (HVA), Intermetatarsal Angle (IMA) and Interphalangeal Angle (IPA) were performed in a third-party software solution. The longitudinal axis estimate was generated automatically for each patient-specific metatarsal and phalanx model by first finding the center of the specific bone in proximal to distal orientation and by analyzing its cross sections at different locations. In sequence, the software selected the straight-line representative for the center of the bone by applying robust line-fitting routines. The software then automatically registered a mathematical model of the foot and ankle on the image and computed the location of measurement landmarks and longitudinal axes of bones of interest.
The study concluded that semi-automatic measurements are reproducible and comparable to measurements performed manually. Intraobserver reliability for semi-automatic HVA, IMA, and IPA was superior to manual measurements. The software could differentiate pathological from non-pathological conditions when subjected to semi-automatic measurements. (Carvalho et al. Foot and Ankle Surgery, 2022)
Stanmore Classification of Hallucal Sesamoids
Metatarso-sesamoid joint space narrowing should be a parameter for hallucal sesamoid classification, and should be used in addition to the 4-stage AOFAS scale for sesamoid position. (Welck et al, Foot Ankle Surg)
Normal Ranges for MPA and Alpha Angle on WBCT
In the largest study of its kind known to date, researchers aimed to define normal ranges for metatarsal pronation angle (MPA) and the α angle for WBCT images.
Measurements were calculated from digitally reconstructed radiographs that were generated from the 3D volumes. Single coronal slices were used, oriented parallel to the floor in the coronal plane and along the axis of the first metatarsal in the sagittal plane. These images were then reoriented in the axial plane to align with the long axis of the third metatarsal, and a perpendicular line to this that bisected the sesamoids was chosen as the specific coronal slice for the two measurements.
Researchers found the “normal” range to be between between -5 and 16 degrees for the MPA and between -4 and 18 degrees for the α angle. In general, researchers concluded most patients have a “constitutional, mild metatarsal pronation.” The study results suggested that as the hindfoot goes into valgus, there is a greater pronation of the metatarsal. (Ali-Asgar Najefi, FRCS, et al, Foot Ankle Int)
WBCT Confirms 1st TMT Instability in HV & HR Patients
- Compared to controls, WBCT scans of hallux valgus (HV) & hallux rigidus (HR) patients confirmed signs of first ray instability at the TMT joint are often present.
- Dorsal translation of the M1 and plantar gapping were other common pathological features on WBCT scans of HV and HR patients.
- The same scans showed C1 morphology is likely not a predisposing factor for first ray instability in HV and HR patients.
Four measurements were performed in the sagittal plane at the mediolateral center of the TMT joint. The inclination of the first TMT was defined as the angle between the longitudinal axis and the distal articular surface of C1. The first TMT joint angle was measured between the articular surfaces of C1 and M1 at the mediolateral center of the first TMT joint. The dorsal translation of M1 at the first TMT joint was defined as a step-off or discontinuation of the curvature along the plantar or dorsal borders of C1 and M1. To quantify dorsal translation of M1, plantar distance was defined as a vertical distance between the most inferior point of distal articular surface of C1 and proximal articular surface of M1 at the mediolateral center of the TMT joint.
In the axial plane, the inclination of the first TMT was measured at the dorsoplantar center of the first TMT joint. Thicker MPR slices were utilized to allow for measurements of four different angles including hallux valgus angle (HVA), first-second intermetatarsal angle (IMA), C1-M1 angle, and the middle cuneiform-second metatarsal angle (C2-M2). To determine varus angulation of proximal M1 (axial instability) at the first TMT joint, C1-M1 angle was defined as an angle between the longitudinal axes of C1 and M1. To determine forefoot adduction, simplified metatarsus adductus angle, C2—M2 angle was measured.
In the coronal plane, a total of four angulations were assessed: Rotational profile of the distal aspect of C1 and proximal aspect of M1 at the first TMT joint, rotational profile of the distal aspect of M1, and the forefoot arch angle. Distal C1 rotation and proximal M1 rotation angles were defined as angles between the vertical axes of C1 and M1 and the perpendicular line to the ground (pronation +/supination -). The vertical axes were drawn to connect midpoints of the interquartile lines of C1 and M1 just proximal and distal to the first TMT joint respectively. Rotational profile of the distal aspect of M1 (distal M1 rotation angle) was measured as an angle between a line connecting far points of the medial and lateral sesamoid sulcus and the floor line. (Dr. Hee Young Lee et al, International Orthopedics)
Blog Posts
Adult acquired flatfoot deformity (AAFD) is a progressive, complex 3-dimensional pathology characterized by peritalar subluxation (PTS) of the hindfoot. Although this debilitating disorder is commonly associated with dysfunction in the posterior tibial tendon, there are various underyling bone and joint abnormalities. Because each component plays an important role in the structural stability of the medial longitudinal arch, compromise of these structures leads to various components of the overall deformity.
Studies
In a case control study with 12 patients (8 with flatfoot valgus and four asymptomatic), less subtalar contact was demonstrated in patients with posterior tibial tendon dysfunction. (Ananthakrisnan et al, J Bone Joint Surg)
In a case series with 37 patients with posterior tibial tendon disorder, an increased deformity was demonstrated in these patients when evaluating the talo-navicular and navicular cuneiform joints, and subluxation of the first tarsal-metatarsal joint. (Greisberg et al, Foot Ankle Int)
When measuring subtalar alignment using angles between the bottom facet of the talus and the ground and the angle between the upper and lower facets of the talus, both of these angles differ significantly between patients with adult type II acquired flatfoot and normal patients. These measures can be used to identify patients with higher risk of progressive deformity and subtalar joint degeneration. (Cody et al, Foot Ankle Int)
Researchers at the University of Iowa applied joint coverage & distance mapping technology to weight bearing CT scans in order to understand what happens to the transverse tarsal joint (TTJ) in patients who have progressive collapsing foot disorder (PCFD). Their results found that most of the pathology associated with PCFD is found in the peritalar subluxation of the TTJ.
The researchers analyzed the subtalar joint in 20 stage I flexible PCFD patients and 20 controls using 3D distance maps (DMs) and coverage maps (CM) on WBCT images.
No significant differences were found in the DM measurements between control and PCFD patients. However, when it came to coverage mapping, a significant difference was observed. In PCFD patients:
- There was a significant decrease in coverage on medial talar head and plantarmedial regions of the calcanelcuboid interface.
- Subluxation occurred on both the talar head and calcaneocuboid facet. Significant subluxation was noted on the medial side of the talar head in patients with PCFD, especially on its plantar aspects. Parrellely, the lateral regions on the talar head had increased coverage when compared to controls.
- These results eliminated pure plantarflexion as the cause of subluxation and instead pointed to medial abduction and external rotation of the navicular being the root cause.
The information provided by the 3D mapping, specifically related to plantarflexion and subluxation may be of particular value when diagnosing, staging, and estimating treatment impacts in PCFD. (Behren, Dibbern, Lintz, Netto et al.)
WBCT vs. X-Ray
To date, weight-bearing radiographs have been the cornerstone for planning surgeries on flatfoot. The technique, however, has limitations due to the superimposition of the bones and the lack of reproducibility. Weight bearing CT scan is a very useful technique for evaluation of flatfoot associated complications. It overcomes the limitations of radiographs by providing multiplanar three-dimensional assessment of the foot in the natural weight-bearing position and at the same time being easily reproducible and consistent for the measurements around the foot (Pilania et al, Indian J Radiol Imaging)
WBCT is a more sensitive modality that can better quantify structural deformity compared to plain radiographs. (Day et al, Foot Ankle Int)
WBCT is more sensitive than X-Ray in detecting significant deformity, including Meary’s angle and talonavicular coverage angle in flat foot patients. (Haleem et al, J Bone Joint Surg)
Further Reading: AAFD: Conventional Radiographs are not Enough! I Need the Third Dimension
WBCT vs. CT
When compared to conventional, NWB CT, WBCT was more accurate in demonstrating pronounced deformity and increased valgus in flat foot patients since it shows the bone relationship in standing physiological load. WBCT proved to be correlated more strongly with markers of flat foot deformity than conventional CT by revealing more pronounced hindfoot valgus. The authors concluded that conventional NWB CT scans could be used to assess flat foot but not as a surrogate to WBCT, with possible underestimation of the deformity. (Kunas et al, Foot Ank Surg)
Weight-bearing CT scan is a very useful technique for evaluation of flatfoot and associated complications. The definite advantage over the conventional cross-sectional scanners is the weight-bearing capability. (Pilania et al, Indian J Radiol Imaging)
Proposed Appropriate Use for WBCT
A consensus group comprising of foot & ankle surgeons from University of Iowa, University of Colorado, Hospital for Special Surgery, Washington University, University of Washington, New York University, Johns Hopkins, Georgetown, and Cedars-Sinai Medical Center reached unanimous 100% consensus that WBCT, if available, should be used in surgical planning for treatment of progressive collapsing foot deformities. (de Cesar Netto et al, Foot Ankle Int)
Proposed Standardized WBCT Measurements
WBCT has allowed for easier and more direct assessment of the coronal plane hindfoot component of the deformity, previously described as PTS, where there is an external rotation, eversion and abduction deformity of the foot underneath the talus through the triple joint complex. For many years, PTS was measured at the posterior facet of the subtalar joint. More recently, subluxation of the middle facet has been proposed as a more accurate and reliable marker of symptomatic AAFD, enabling earlier detection. This study is the first to compare WBCT measurements of subtalar joint subluxation at the posterior and middle facets as markers of PTS in patients with AAFD. We found a positive linear correlation between the measurements, with subluxation of the middle facet being significantly more pronounced than that of the posterior facet by an average of almost 18%. This suggests that middle facet subluxation may provide an earlier and more pronounced marker of progressive PTS in patients with AAFD. (de Cesar Netto et al, Foot Ankle Int)
Investigators determined that symptomatic flat foot patients demonstrated an increased innate valgus orientation of the posterior facet of the subtalar joint when assessed but the subtalar joint axis (STJA), which takes into consideration 2 landmarks within the talar bone (angulation between the talar posterior facet of the subtalar joint and the talar dome measured in coronal plane WBCT images. (Apostle et al, Foot Ankle Int)
3D WBCT semiautomatic measurements of foot ankle offset (FAO) made via the TALAS tool significantly correlated with some traditional markers of pronounced AAFD. Measurements of FAO were also found to be slightly more reliable than the manual measurements. The FAO offers a simple and more complete biomechanical and multiplanar assessment of the AAFD, representing in a single measurement the 3D components of the deormity. (de Cesar Netto et al, Foot Ankle Int)
Studies
Cone beam CT allows cross-sectional imaging of the tibiofibular syndesmosis while the patient bears weight. This may facilitate more accurate and reliable investigation of injuries to, and reconstruction of, the syndesmosis. (Patel et al, Journal of Bone & Joint Surgery)
Cost effectiveness of WBCT first approach in syndesmosis diagnosis
WBCT vs. X-Ray
Conventional radiographs cannot predict syndesmotic injuries reliably. CT scans outperform plain radiographs in detecting syndesmotic mal-reduction. Additionally, the syndesmotic interval can be assessed in greater detail by CT. (Krahenbuhl et al, Skeletal Radiol)
Patients with potential unstable Weber B fractures underwent a WBCT exam over a span of 10 months. None of the patients had a widening of the medial clear space significantly different from what was measured on weight bearing X-Ray. However, WBCT did uncover additional clinical findings in 40% of patients. Osteoarthritis and hallux valgus were the most common secondary pathologies. More surprising was that secondary fractures were found in 22% of patients and syndesmosis lesions were found in 4% of patients. (Watch webinar here)
WBCT vs. CT
Weight bearing CT demonstrates significantly greater diastasis in unstable ankles than conventional non-weightbearing CT (del Rio et al, Foot Ankle Surg)
Performing cone-beam CT has the advantage of radiation dose reduction and evaluation under weight-bearing conditions. Cone-beam CT under weight-bearing is most appropriate for the evaluation of the stability of the distal tibiofibular joint under compression. (Jungmann et al, Open Access J Sports Med)
Bilateral Advantage
This study…underscores the substantial utility and importance of using contralateral, uninjured side as a valid internal control whenever the need for confirming potential syndesmotic injury arises. (Hagermeijer et al, Foot Ankle Int)
Without the contralateral ankle, researchers could not determine whether syndesmosis was attributable to an injured syndesmosis or a consequence of loading of normal syndesmosis. (Osgood et al, Foot Ankle Surg)
Dynamic change in area and weight bearing comparison with the contralateral uninjured ankle are two parameters that may prove useful in the future for predicting syndesmotic instability (del Rio et al, Foot Ankle Surg)
Proposed Standardized WBCT Measurements
Syndesmotic Area Measurement
Localize the midpoint of the tibial plafond’s articular surface in the axial, coronal, and sagittal planes. Create an axial image 10 mm proximal to the tibial plafond’s midpoint, with a standardized field of view of 100 mm. On this selected image, use an angle measurement tool to draw two intersecting lines along the anterior and posterior cortical surfaces of both the distal fibula and tibia. Use a free hand area measurement tool to trace the region of interest bound by the anterior line, posterior line, medial fibular cortex, and lateral tibial incisura to create a syndesmotic area. The Syndesmosis Area Measurement is reliable and reproducible (del Rio et al, Foot Ankle Surg)
Measuring Instability in Patients with Weber B Malleolar Lateral Fractures
A study showed the following WBCT measurements are significantly greater on the uninjured ankle for patients with unilateral instability and Weber B fractures: distal syndesmosis in the axial plane (distance and area 1 cm above the tibial plafond and included fibular rotation; tibiofibular distance measured at the middle aspect of the distal tibiofibular articulation; lateral malleolar fracture displacement on the sagittal plane; fibular shortening on the coronal plane as represented by the distance between the fibular tip and the tibial plafond. The following measurements were found to not be significantly different: medial clear space (MCS) distance, syndesmotic area, and anterior and posterior tibiofibular distance.
For 3D measurements, syndesmosis volume spanning from the tibial plafond to 5cm proximally was indicated to be an outstanding diagnostic test. Syndesmosis volume up to 3cm proximally also showed high sensitivity and specificity.
The study concluded that WBCT can effectively diagnose syndesmotic instability in the presence of a Weber B ankle fracture among patients with symmetric MCS who would otherwise not necessarily undergo surgical intervention. Researchers noted that WBCT can be useful when the tibiotalar relationship appears to be intact but clinical concern for syndesmotic instability exists, which may necessitate surgical stabilization. (Bhimani et al, JAAOS Feb 2022 Vol 30, No 3)
Problems associated to the subtalar joint can have a significant impact on function, preventing participation in sports and normal daily activities. Common pathologies affecting the joint include instability following ligamentous injury and painful flat feet in children and adults.
Studies
Significant differences in most measurements: distance between fibula and calcaneum, lateral subtalar joint space, talus-calcaneus overlap, and calcaneus-navicular distance.(Hirschmann et al Eur Radiol)
In a case control study with 24 patients (19 with flatfoot valgus and 5 asymptomatic), a higher prevalence of lateral impact in the subtalar joint within the tarsal sinus (92% vs. 0%) and calcaneal-fibular joint (66 vs. 5%) in comparison with controls. (Malicky et al, J Bone Joint Surg)
When Supinated external rotation injuries were evaluated using WBCT, even though the Medial clear space distance was restored, residual findings included posterior malleolar involvement, fibular shortening, fibular rotation, fracture comminution, and asymmetry of the distal tibiofibular joint. The results of a prior study suggest that measuring MCS distance on a WB-CBCT scan may be able to distinguish between potentially stable and unstable fractures and, by extension, determine which ankles may be considered for operative intervention. (Lawler et al, Quant Imaging Med Surg, 2020)
WBCT vs. X-Ray
A substantial amount of malrotation of the distal fibula can be missed on radiographs and contribute to a poor outcome when SER injuries are inadequately reduced. For determining stability of the ankle mortise in a supination external rotation, weight bearing radiographs may miss a substantial amount of rotation of the distal fibula and can contribute to a poor outcome when supinated external injuries (SER) are inadequately reduced. The reliability of MCS measures based on standard radiographs has been debated. Bone overlap and variability in ankle position and radiographic technique are some of many factors that can make interpretation of radiographs difficult in SER ankle fracture evaluations. (Lawler et al, Quant Imaging Med Surge, 2020)
In a study out of the University of Utah, calcaneal moment arm measurements were compared between plain radiographs and WBCT. It was found that while both modalities can provide consistent HAV measurements, radiographs may overestimate the varus alignment by an average of 3.9mm when compared to WBCT. WBCT was less susceptible to error even with the presence of hardware and motion artifact in large part by utilizing 3-dimensional images of the anatomical boney structures and providing clinically useful information concerning alignment as they are performed under natural standing conditions. WBCT also offers the benefits of increased accuracy which is present in cross-sectional imaging paired with physiologic alignment under weight bearing conditions. (Arena et al, Foot Ankle Int)
WBCT vs. MRI
MRI is not primarily used for assessing hindfoot alignment but is a commonly performed technique for investigating foot and ankle pathology as it provides useful information regarding bony and soft tissue architecture. In the setting of hindfoot malalignment, MRI is requested to look at soft tissue derangement and to quantify joint degeneration. However, an ability to comment on hindfoot alignment may help to contextualize these findings. Various methods have been proposed for the evaluation of hindfoot alignment using MRI. In our study, the measurement of the tibiocalcaneal angle (TCA) on coronal MR images correlated with WBCT measurements of hindfoot alignment, namely foot ankle offset (FAO), calcaneal offset (CO) and hindfoot angle (HA). However, the calcaneofibular ligament angle (CFLA) on MRI displayed a negative correlation to WBCT images, but without reaching statistical significance except when compared to CO. Attention should be paid to the TCA when reporting MRI studies. (Haldar et al, Skeletal Radiology, 2021)
Proposed Standardized WBCT Measurements
In a novel and landmark study, WBCT was used to characterize the physiologic weightbearing morphology of the subtalar joint in asymptomatic individuals. They demonstrated that in the normal anatomy of the posterior facet of the subtalar joint, the articular facet becomes progressively more angulated into a valgus position from anterior to posterior along its longitudinal length, when measured by the subtalar vertical angle (SVA – angle between the talar posterior facet of the subtalar joint and a vertical line perpendicular to the foot.) The authors concluded that WBCT was an effective imaging modality for assessing the joint’s morphology, demonstrating a standard baseline threshold of normal anatomy, with implications for surgical planning in reconstructive hindfoot surgery. (Colin et al, Foot Ankle Int)
A novel method enables quantification of inversion-eversion at the subtalar joint based on WBCT in combination with 3D full field digital volume correlation (DVC) computed displacement. (Fernandez et al, Sci Rep 2020)
To utilize WBCT to calculate the calcaneal moment arm, the coronal cut is selected based on the widest tibial diaphyseal distance at the most proximal edge of the image. Circles are placed along the cortical edges along the tibia. A line is then used to measure the distance from the distal tibial plafond to the center of the radius of the proximal circle bisecting the center of the radius of the distal circle. This measurement is then recorded and rounded to the nearest whole number in millimeters. The distal aspect of this line is extended to the most inferior portion of the tibial axis. The axial cut is visualized in the plane that depicts the most inferior aspect of the calcaneus; the center is marked and transferred to the previously used coronal cut using the “localizer mode” function. A line parallel to the ground is used to measure the distance from the tibial axis to the mark representing the most inferior portion of the calcaneus on the coronal view. Varus alignment is represented by a negative value, while valgus alignment is represented by a positive value in millimeters. (Arena et al, Foot Ankle Int)
Researchers determined that there was a novel and noninvasive analysis to quantify subtalar joint instability based on three-dimensional WBCT imaging. This approach overcame former studies using trans-osseous fixation to determine three-dimensional subtalar joint displacement. Using cadavers, researchers sought to establish and define reference values for normal displacement in the subtalar joint and to quantify displacement after sequential injuries to the ligaments stabilizing the subtalar joint using noninvasive software modalities that would be applicable to clinical practice.
The highest translation could be detected in the dorsal direction and the highest rotation occurred in the internal direction when external torque was applied to the foot without load. These displacements differed significantly from the condition containing intact ligaments, with a mean difference of 1.6 mm (95% confidence intervals (CI), 1.3 to 1.9) for dorsal translation and a mean of 12.4 degrees (95% CI, 10.1 to 14.8) for internal rotation. (Burssens et al, J Orthop Res)
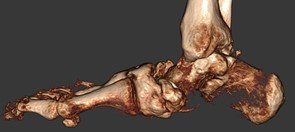
Charcot foot is a complex foot deformity involving subluxations and dislocations and fractures of the foot. It is most commonly seen in patients with uncontrolled Diabetes or other neurological deficiencies. When the nerves to the foot and ankle are not working properly, the blood vessels may increase blood flow to the bones, causing the bones and joints to get weaker, leading to collapse of the joints and bones. The foot may become flat and deformed and develop bone prominences that can become painful and cause open wounds.
Traditional X-Ray can not give the physician the amount of information needed to access the complex midfoot and rearfoot joints in early stages of Charcot. MRI images will show inflammation in the bones, yet make it more difficult to address the spatial orientation of the bones and joints as compared to the weight bearing CT scan.
It is critical to diagnose Charcot deformity in its early stages in order to reduce the chance of significant collapse or fractures. Early diagnosis is best done with CT imaging. The pedCAT weight bearing in office CT system gives the treating physician a 3-dimensional view of the orientation of the joints. It will also show the difference in the stages of Charcot foot. This is important as each stage is treated differently.
OCD lesions of the talus are common injuries in athletes. While CT arthrogram is recognized as the best technique to evaluate the ankle for this condition, CBCT is a lower dose alternative and allows for weight bearing analysis.
CBCT VS. CT
Cone Beam CT (CBCT) arthrogram can diagnose osteochondral (OCD) lesions in the ankle in high correlation with conventional CT arthrogram – but with up to 10 times less radiation, according to preliminary results of a recent study.
Methods Used
The researchers obtained a CT scan and a CBCT scan (IRB 021-A01771-40) for 18 patients. Patients were injected with intra-articular contrast (lomeron 300 or lopamiron 300) as well as steroids if the patient’s treatment plan called for them. Once the contrast was injected, patients underwent a conventional CT scan followed by a CBCT scan.
| Evaluation Metric | Correlation Coefficient |
| Identification of OCD lesion | 1 |
| Localization of OCD lesion | 1 |
| Size of OCD lesion | .94 |
| Stability of OCD lesion | 1 |
The CBCT arthrogram was always performed after the CT arthrogram, so the contrast media appeared less dense on the second exam. Since the CBCT scans were performed in the weight bearing position, 4 of the scans also provided additional information. Three of the scans revealed a flat foot deformity, while one scan revealed a pes cavus deformity.(Tordjman et al)
Knee Indications
Patellar instability is a common clinical problem in orthopaedics, but the etiology is multifactorial, the evaluation complex, and the treatment remains controversial.
WBCT vs. CT
Conventional CT scans are performed with the patient in supine position, with the knee fully extended and the lower limb muscles relaxed, thus far from the physiological weight-bearing conditions. It is known that quadriceps muscular contraction and knee flexion which occur in weight bearing influence patellar stability and alignment. Moreover, the evidence from the literature supports the fact that removing these conditions can affect stability and alignment parameters measurement. Cone Beam CT technology has recently allowed new devices to collect scans at lower limbs in realistic and physiological weight-bearing conditions. (Lullini et al)
When comparing non-WBCT and WBCT images of the knee, significant differences were found for femorotibial rotation, tibial tuberosity-trochlear groove (TTTG) distance, and lateral patellar tilt angle. TTTG is less pronounced and lateral patellar tilt angle decreases in weight bearing CT examinations. (Hirschmann et al)
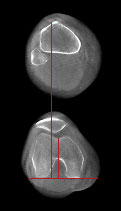
When measured by a CT scan and obtained from a subject while weight bearing on a flexed knee, the TTTG offset is reproducible and the distance is less than that obtained via conventional CT scan. (Marzo et al)
Measurement of TTTG offset in patients after surgical treatment for recurrent patellar dislocation was reduced on images obtained on WBCT compared to those obtained with conventional CT. Moreover, all measures of patellofemoral stability and alignment were more consistent when obtained with WBCT compared to conventional CT. (Lullini at al)
WBCT also offers the opportunity for the clinician to assess if findings are relevant given ability to compare the symptomatic side to the non-symptomatic side. Measurable differences may be unilateral or symmetrical and that can be easily compared and correlated with exam findings.
Patellar fractures have an incidence of about 1. 2 per 100,000 per year and constitute 1% of all fractures.
Evaluation and classification of patellar fractures is based on anteroposterior (AP), lateral, and skyline view radiographs of the knee. A recent study, however, showed that adding computed tomography (CT) to the evaluation led to changes in management plans in almost half of the cases. In that study, CT provided more accurate evaluation of comminuted fractures of the lower pole than did conventional radiography (Lazaro et al).
“We compared CBCT with standard x-ray in the diagnosis of foot and ankle fractures (and Lisfranc lesions), tibial plateau fractures, wrist and scaphoid fractures, elbow fractures. We can say that if compared to standard X-ray, CBCT has higher sensitivity and specificity in the proper identification and typing of these kind of lesions, with low exposition dose if compared to MDCT.” (Ricci et al)
X-Ray vs WBCT in Post-Operative Follow Up
X-Ray Study: Post-operative X-Rays appeared to show a healed posterior shear tibial plateau fracture.
WBCT Study: However, the WBCT scan reveals a portion of the fracture is not yet healed.


The equipment is designed to perform exams in sitting or supine position and is relatively compact, allowing installation in many radiology departments and private practices. CBCT following intra-articular injection of Iodine contrast (CBCT-Arthrography) may render exquisite detail of the articular cartilage using very thin slices and multiplanar reformation. In addition, the trabecular architecture of subchondral bone is far better visualized on CBCT than on CR. In this regard, CBCT-Arthrography (CBCT-A) may be very promising technique for precise staging of cartilage lesions of the ankle as an alternative for Multi Detector Computed Tomography (MDCT). (Posady et al)
Analysis of CBCT-Arthrography resulted in an upstaging in 17 patients with a statistically significant difference (p<0.05) for the degree of detachment between MRI and CBCT-Arthrography. (Desimple et al)
The ability to conduct NWB and WB exams in CBCT with a dose profile that is favorable in comparison to multidetector CT (MDCT) and with image quality sufficient for morphological analysis of joint space narrowing and meniscal extrusion could provide a valuable tool for OA diagnosis and treatment assessment. (Thwait et al)
Based on our present and previous results, we propose that, for OA diagnostics, clinical CBCT enables not only quantitative analysis of articular cartilage but also subchondral bone vBMD. Quantitative information on both cartilage and subchondral bone could be beneficial in OA diagnostics. (Turunen et al)
Patient position significantly affects lower extremity alignment in osteoarthritic knees. This study provides important data regarding the preoperative evaluation of realignment surgery in total knee arthroplasty and high tibial osteotomy. We believe that these results are an important contribution to the knowledge regarding knee osteoarthritis. (Fujii et al)
Surgeons should be aware that there is a difference between weight-bearing and non-weight-bearing alignment in patients with Kellgren-Lawrence 3 and 4 with a load-bearing axis outside of the articular surface (Kennedy 0 or 1 or 5). According to this study, these changes seem related to the amount of articular wear and the load-bearing axis. This is important for the preoperative planning process in PSI-assisted TKA. More concave side ligamentous release or more constraint can be necessary than imagined based on the PSI alignment result. Full-leg standing radiographs should be performed for PSI-assisted TKAs to analyse the position of the load-bearing axis. (Paternostre et al)
Knee joint alignment changes significantly in the upright weight-bearing position using CT when compared to supine non-weight-bearing CT.(Hirschmann et al)
CBCT was an effective tool, providing reproducible measurements of the patellar tilt angle and the rotational alignment of the femoral/tibial component. Furthermore, it allowed bone and tendon-muscle structures analysis with little impediments from metal artefacts. Advances in knowledge: CBCT allows easy and accurate measurements on the rotational axial plane, unburdened by image quality impairment due to metal artefacts. (Nardi et al)
WBCT vs X-Ray
Prior research has primarily focused on the biomechanical behavior of various reconstruction techniques. There is little data on ligament elongation patterns and how to accurately identify quantitative radiographic landmarks for insertion sites that would result in the smallest length changes during insertion.
Dr. Sandro Hodel, MD et al. out of the Department of Orthopedics, Balgrist University Hospital, in Zurich, Switzerland, found that while the superficial MCL (sMCL) had only limited length changes throughout full ROM, the posterior oblique ligament (POL) demonstrated substantial shortening starting from 30° of knee flexion. Femoral sMCL graft placement directly posteroinferior to the center of the anatomical insertion of the sMCL demonstrated the most isometric behavior during knee flexion.
The authors felt that the most important finding was that the sMCL demonstrated only limited length changes throughout the full ROM compared with a significant shortening of the POL during knee flexion under weight bearing conditions. These findings aid in guiding medial knee reconstruction to prevent repetitive stretching or slackening of the graft and eventual graft failure; or over constraint of the medial compartment. The authors recommended the POL graft strand should be tensioned and fixed in less than 30 degrees of knee flexion to prevent overtightening in extension. (Dr. Sandro Hodel, MD et al., Orthopaedic Journal of Sports Medicine)
Hip Indications
Hip dysplasia is the medical term for a hip socket that doesn’t fully cover the ball portion of the upper thighbone. This allows the hip joint to become partially or completely dislocated. Most people with hip dysplasia are born with the condition.
WBCT VS. CT
A research study by Dibbern et al provides preliminary evidence for the use of WBCT in hip dysplasia imaging.
In the study, patients with hip dysplasia and and patients with healthy hips underwent 1) a WBCT scan in neutral position, and 2) a WBCT scan with the hip stressed in maximal external rotation. The dysplastic patients also underwent a supine CT.
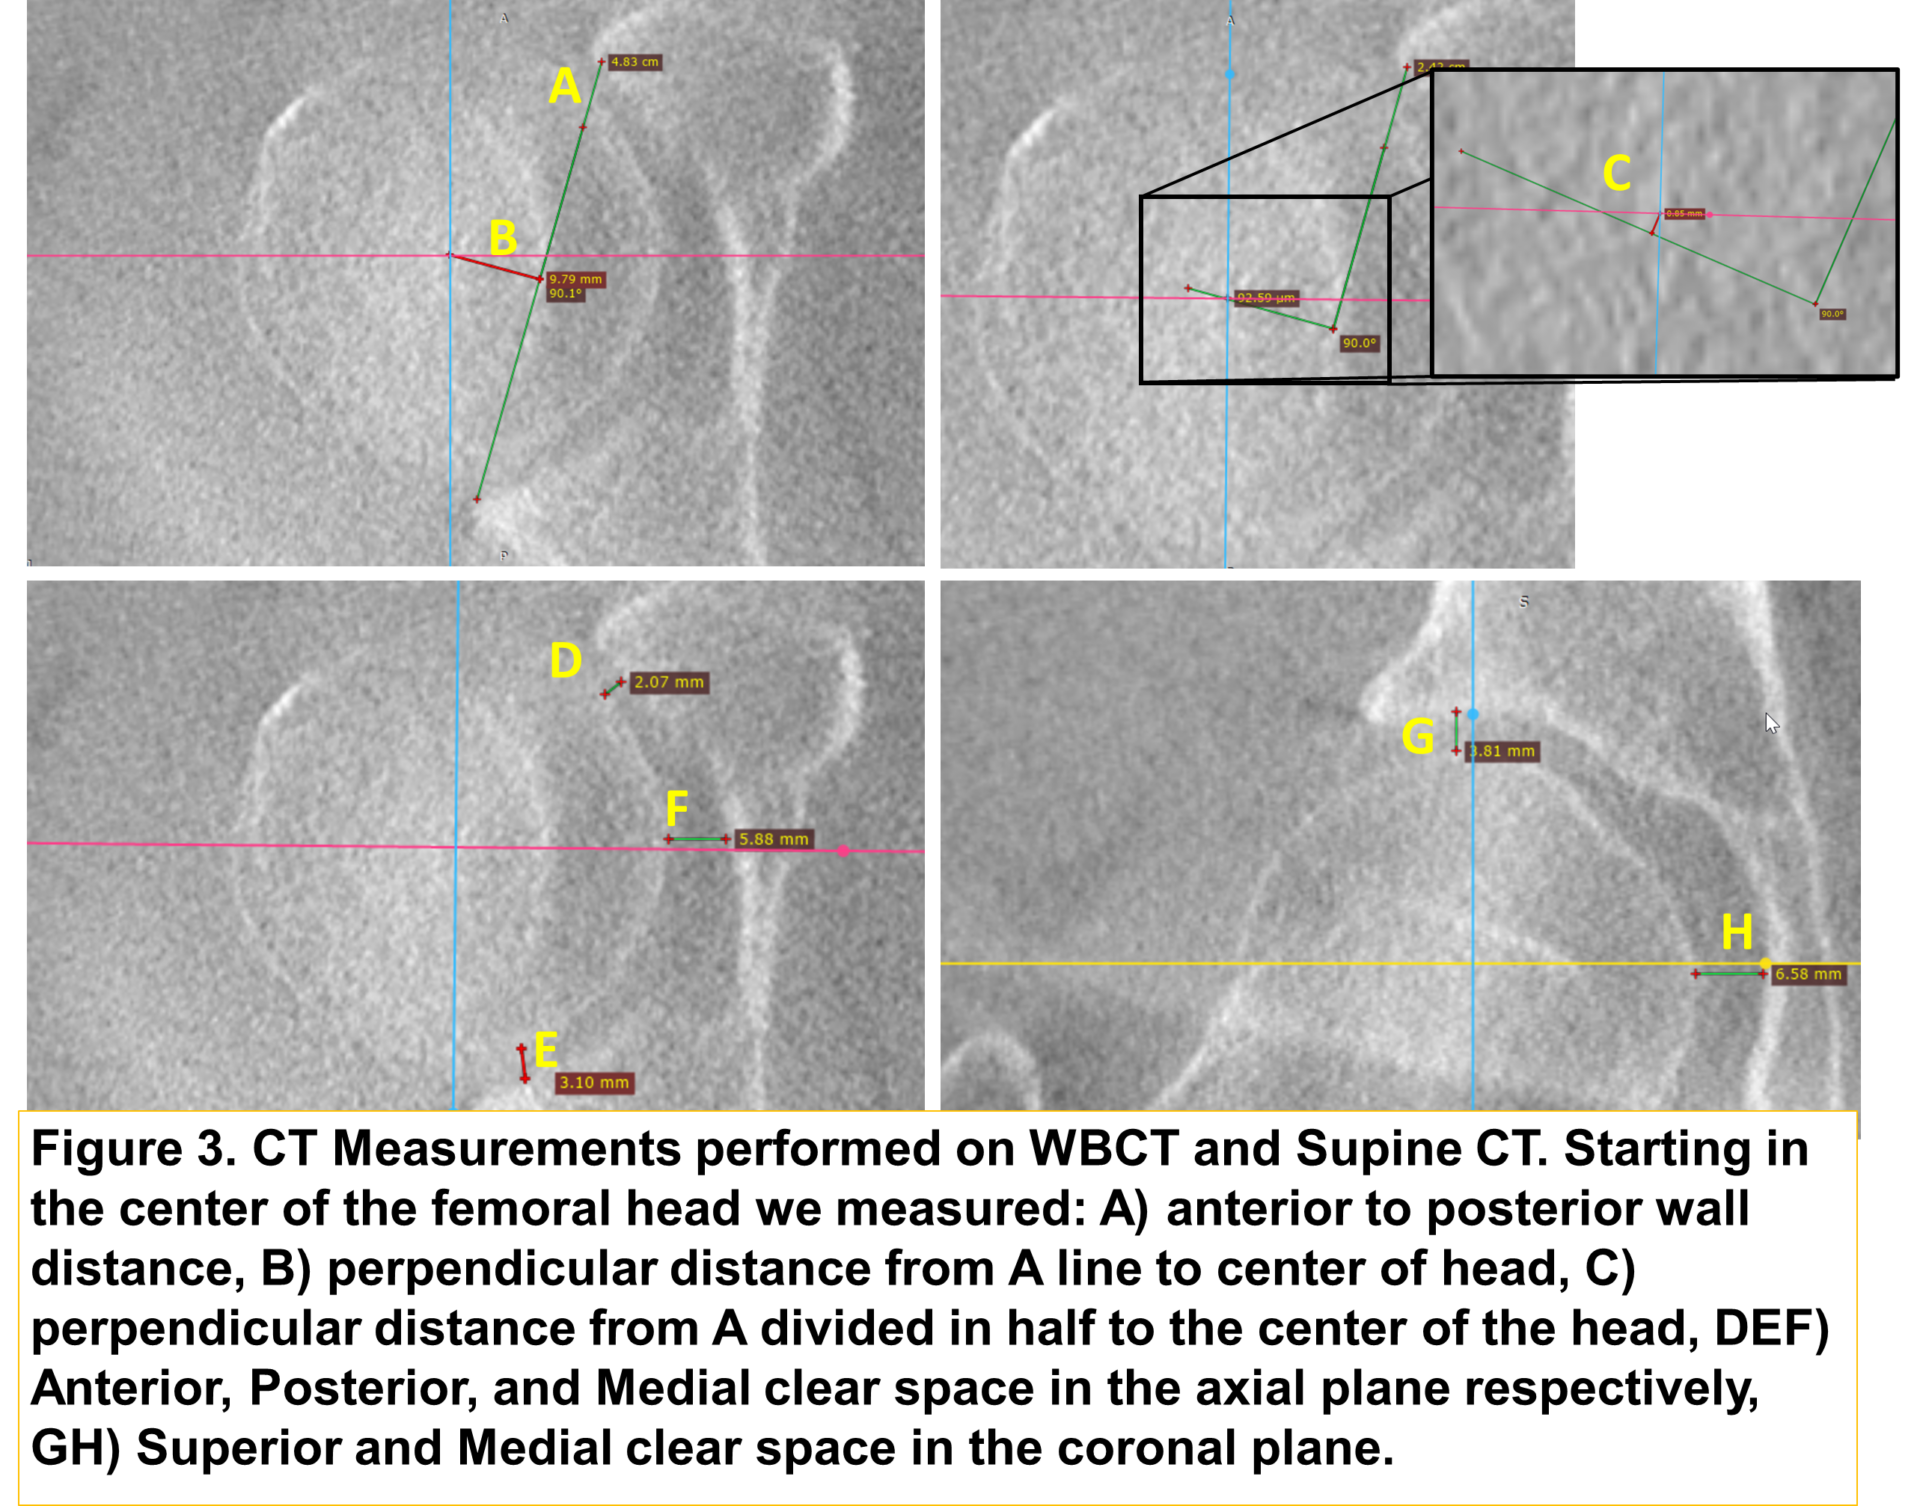
Starting in the center of the femoral head, the following measurements were performed on the neutral WBCT and stressed WBCT scans.
1) Anterior to posterior wall distance
2) Perpendicular distance from 1 line to the center of head
3) Perpendicular distance from 1 divided in half to the center of the head
4) Anterior, posterior and medial clear space in the axial plane respectively
5) Superior and medial clear space in the coronal plane.
A significant increase in the distance from the medial wall to the head was found when comparing stressed views of dysplastic patients and healthy patients. Significant differences in the femoral head center to the wall line were also seen in neutral versus stressed WBCT in dysplastic patients but not in healthy patients.
In healthy patients, a significant difference was seen in superior joint space comparing neutral and stressed views, but not in dysplastic patients.
No significant differences existed in the center of head to wall line for the supine vs. stressed views, demonstrating that WBCT may be able to visualize changes in measure of hip instability not detected by supine views.
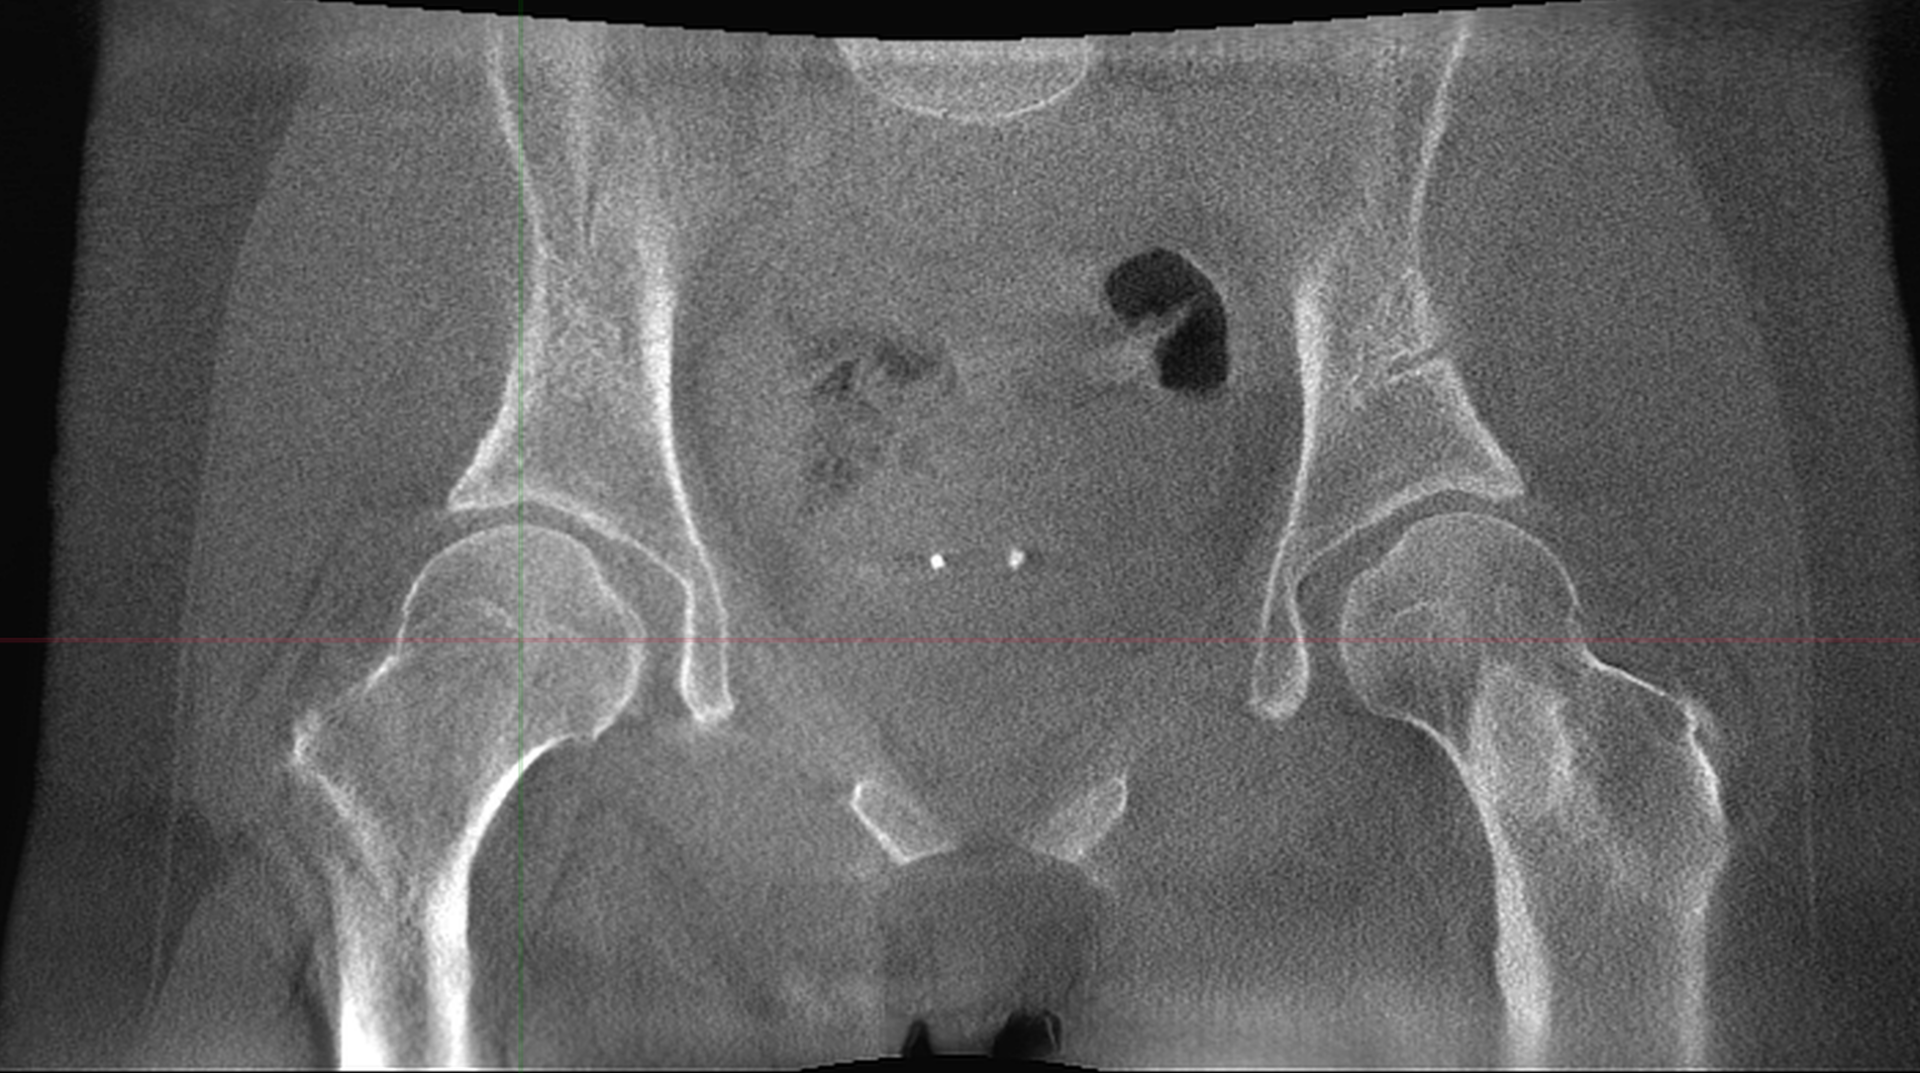
Courtesy of Dr. Michael Willey, University of Iowa (above & right)
Pincer impingement
Cam impingement
Upper Extremity Indications
The scaphoid bone is one of the carpal bones in your hand around the area of your wrist. It is the most common carpal bone to break (fracture). A scaphoid fracture is usually caused by a fall on to an outstretched hand. Symptoms can include pain and swelling around the wrist. Diagnosis of a scaphoid fracture can sometimes be difficult, as not all show up on X-rays. Treatment is usually with a cast worn on your arm up to your elbow for 6-12 weeks. Sometimes surgery is advised. Correct diagnosis and prompt treatment of a scaphoid fracture can help to reduce complications. source
A systematic literature review conducted by Fitzpatrick et al identified 5 studies, with 439 patients, and observed CBCT to be 87.7% (95% CI 77.6–93.6) sensitive and 99.2% (95% CI 92.6–99.9) specific for scaphoid fractures. For carpal fractures, CBCT was observed to have a pooled sensitivity and specificity of 90.6% (95% CI 72.7–97.2) and 100% (95% CI 99–100) respectively. For distal radius fractures, CBCT sensitivity was 90% (95% CI 67–98) and specificity was 100% (95% CI 10–100). The overall inter-rater agreement effect was shown to be 0.89 (95% CI 0.82–0.96), which is deemed to be almost perfect. It was concluded CBCT is an accurate diagnostic tool for occult radiocarpal cortical fractures, which could replace or supplement radiographs. We believe CBCT has a promising role in the acute radiocarpal fracture diagnostic algorithm in both emergency and trauma departments.
CBCT in the Emergency Department
The aim of this study was to evaluate the use of early CBCT in the diagnosis of suspected scaphoid fractures presenting via the Emergency Department (ED). The imaging pathway was adapted to include early CBCT in adult patients with a persisting high index of clinical suspicion for scaphoid fracture despite normal radiographs. 100 CBCT wrist scans were performed on 99 adult patients. 94% of CBCT scans were performed within 1 day of referral. 25% of scans demonstrated acute injuries including 12 radius, 6 trapezium and 2 scaphoid fractures. For fracture, CBCT had a sensitivity of 96.2% and specificity of 100%. There was a highly significant difference in interobserver variation between fracture detection on CBCT and radiographs. CBCT heralds the potential for early accurate diagnosis of radiocarpal fractures, at lower cost, shortening clinical pathways and reducing clinical risk in the ED. (Colville et al, Clin Imaging)
CBCT vs. CT
CBCT is a reliable, reproducible, low-radiation technique for diagnosing occult cortical fractures of the scaphoid, as well as occult cortical fractures in the entire wrist, with 100% sensitivity and 95% specificity. The diagnostic performance of CBCT for investigating all types of scaphoid fractures was similar to that of a conventional CT scan, which has sensitivity of 94% and specificity of 97%. (Borel et al, Eur. J. Radiol.)
CBCT vs. X-Ray
Cone-beam computed tomography (CBCT) is an imaging technique generating a higher spatial resolution at a lower radiation dose than MDCT (De Smet et al., 2015) and has shown to be more accurate than conventional radiography for the diagnosis of fractures of the carpal bones (De Smet et al., 2015; Gibney et al., 2019; Neubauer et al., 2018). The effective radiation dose of CBCT is only 0.7–2.4 times higher than conventional radiography (Koivisto et al., 2018). Scanning is faster to perform than radiography with specific wrist projections (Huang et al., 2015). Reporting takes approximately as long as for a MDCT, depending on the experience of the radiologist. The CBCT equipment does not require much space and is therefore suitable for an emergency department environment.
Fifty-two patients with scaphoid fractures all underwent X-Ray and CBCT six weeks after injury. Inter-reader agreement was moderate concerning X-Rays, but substantial concerning CBCT. CBCT proves more accurate and reliable than X-Ray for diagnosing scaphoid union at an early follow-up and prevents longer immobilization and interruption of activity or work. (Farracho et al, Eur J Radiol Open)
“In October 2016, our hospital’s routine for radiological examination of wrist trauma was changed from conventional radiography to CBCT. Since then, all patients above the age of 14 years with wrist trauma have been evaluated with CBCT, without prior radiography. An average of 1086 CBCT wrist examinations are performed per year (2017–2020).” – Krayem et al
CBCT vs. MDCT
For scaphoid fractures, conventional computerized tomography (CT) has a sensitivity and specificity of 82% and 96% respectively. CBCT has a comparable diagnostic accuracy to MDCT but with additional benefits. It produces a more detailed image which allows greater visualization of the area. CBCT produces sub-millimeter resolution ranging from 0.4 mm to as low as 0.09 mm, whilst standard CT has a spatial resolution of 1–2 mm. Although, to date, no cost–benefit analysis has been performed radiocarpal fractures, Faccioli et al. demonstrated that the introduction of CBCT compared to MDCT in the management of complex finger fractures reduces the time of diagnostic work-up and number of diagnostic procedures, improves quality of life and reduces costs. When trialed in the emergency radiology department, CBCT offered a feasible alternative to MDCT for detection of extremity fractures also increasing patient turnover and reducing radiation exposure. (Fitzpatrick et al)
A systematic literature review conducted by Fitzpatrick et al identified 5 studies, with 439 patients, and observed or distal radius fractures, CBCT sensitivity was 90% (95% CI 67–98) and specificity was 100% (95% CI 10–100). It was concluded that CBCT is an accurate diagnostic tool for occult radiocarpal cortical fractures, which could replace or supplement radiographs, and that CBCT has a promising role in the acute radiocarpal fracture diagnostic algorithm in both emergency and trauma departments.
CBCT in the Emergency Room
The aim of this study was to evaluate the use of early CBCT in the diagnosis of suspected scaphoid fractures presenting via the Emergency Department (ED). The imaging pathway was adapted to include early CBCT in adult patients with a persisting high index of clinical suspicion for scaphoid fracture despite normal radiographs. 100 CBCT wrist scans were performed on 99 adult patients. 94% of CBCT scans were performed within 1 day of referral. 25% of scans demonstrated acute injuries including 12 radius, 6 trapezium and 2 scaphoid fractures. For fracture, CBCT had a sensitivity of 96.2% and specificity of 100%. There was a highly significant difference in interobserver variation between fracture detection on CBCT and radiographs. CBCT heralds the potential for early accurate diagnosis of radiocarpal fractures, at lower cost, shortening clinical pathways and reducing clinical risk in the ED. (Colville et al, Clin Imaging)
CBCT vs. X-Ray
Incorporating CBCT into a routine clinical practice as part of a standardized diagnostic algorithm yielded a 50% fracture detection rate in patients with negative wrist radiographs but ongoing clinical concern for radiocarpal fracture. CBCT provides more diagnostic information than radiographs at a lower radiation dose than conventional CT. Given the poor accuracy of radiographs for acute radiocarpal fractures and the high fracture prevalence in this cohort, we feel that CBCT should be regarded as the new standard of care in the investigation of these patients. (Gibney et al, AJR Am J Roentgenol)
CBCT in the Emergency Room
CBCT was performed in patients with suspected radiographically occult radiocarpal fracture following acute injury. Ninety-three radiographically occult wrist fractures were identified in 166 patients with acute trauma and negative radiographs. The trapezium was the most frequently fractured carpal bone, making up 20.4% of wrist fractures. Seventy-nine percent of trapezium fractures involved the volar ridge. The scaphoid was the clinically suspected fractured bone at initial assessment in 84% of patients with trapezium fractures. Fractures of the trapezium in acute wrist trauma are much more common than described in the literature. If initial radiographs are negative, a fracture of the trapezium is more likely to be present than of the scaphoid, despite high levels of clinical suspicion for scaphoid injuries. Cross-sectional imaging should be considered in all cases of post-traumatic wrist pain with negative radiographs. (Gibney et al, Emerg Radiol)
The aim of this study was to evaluate the use of early CBCT in the diagnosis of suspected scaphoid fractures presenting via the Emergency Department (ED). The imaging pathway was adapted to include early CBCT in adult patients with a persisting high index of clinical suspicion for scaphoid fracture despite normal radiographs. 100 CBCT wrist scans were performed on 99 adult patients. 94% of CBCT scans were performed within 1 day of referral. 25% of scans demonstrated acute injuries including 12 radius, 6 trapezium and 2 scaphoid fractures. For fracture, CBCT had a sensitivity of 96.2% and specificity of 100%. There was a highly significant difference in interobserver variation between fracture detection on CBCT and radiographs. CBCT heralds the potential for early accurate diagnosis of radiocarpal fractures, at lower cost, shortening clinical pathways and reducing clinical risk in the ED. (Colville et al, Clin Imaging)
CBCT vs. X-Ray
Fifty-two patients with scaphoid fractures all underwent X-Ray and CBCT six weeks after injury. Inter-reader agreement was moderate concerning X-Rays, but substantial concerning CBCT. CBCT proves more accurate and reliable than X-Ray for diagnosing scaphoid union at an early follow-up and prevents longer immobilization and interruption of activity or work. (Farracho et al, Eur J Radiol Open)
Cone beam CT arthrogram (CBCTa) may be useful for assessment of the TFCC. CBCTa may be a more comfortable and cost-effective alternative that could be utilized at the point-of-care.
Potential advantages over traditional MRI scan include:
- Patients do not need to schedule with or travel to an outside facility for an MRI exam.
- Treating physicians can know as soon as the patient’s first visit if there is a TFCC tear; there is no delay in devising a treatment plan.
- Patient with metal implants, who would be restricted from MRI exam, can obtain advanced diagnostic imaging.
- Digitally reconstructed radiographs are presented with every scan, eliminating the need for a preliminary X-Ray.
- Surgeons can review the full high-resolution scan in conjunction with the radiology report for optimal pre-surgical planning.
Potential positioning advantages include:
- Patients do not need to extend their hand upward into superman position.
- The scan is performed in 25 seconds, as opposed to 45 minutes for an MRI exam.
- A patient is injected with 1cc or less of contrast, as opposed to 8-10cc required for an MRI exam.
Click here to go to the blog post or click here to download the full case study.
News & Events

Lisa Smith, MHA, OTR/L, CHT, CHC, Chief Operating Officer for Optim Orthopedics in Savannah, Georgia,…
Key Points: The most important advantage of weight bearing CT (WBCT), which utilizes cone beam…

Jeff McPherson, MBA, FACMPE, East Tennessee Market President, Tennessee Orthopedic Alliance, highlights says weight bearing…
Key Points: Anterior tibial translation (ATT) and femorotibial rotation (FTR) are the two most common…
Key Points: Subtle Lisfranc injuries often go undiagnosed which can lead to devastating consequences and…
Join us to hear firsthand from Dr. Prater as he shares insights on executing the…

Weight bearing CT (WBCT) allows the patient to stand upright while a gantry rotates around…
Key Points: First tarsometatarsal joint (TMT1) hypermobility is associated with hallux valgus (HV) which is…
